
Building A Detection Lab Around Suricata
A while back there were a flurry of posts from different people about how they were configuring their homelabs, rebuilding them to do X better than something else normally used, and automating this and that. My interest was piqued since I hadn’t played around with my equipment in a while, so I started writing up a post of my own in order to join the fray. Obviously I had to differentiate myself so I chose to focus on the networking aspect of homelabs and started configuring OPNsense. The original goal wasn’t to focus on Suricata, just to briefly mention it before moving on to other things.
As building OPNsense progressed, I found the documentation around Suricata’s use in OPNsense to be very small. Not many people had touched it and done configurations beyond loading some custom Suricata rules, and what there was written on that was also quite small. At the same time, I also kept seeing a common trend that network based IDS solutions were falling out of favor due to the ubiquity of encryption everywhere. Never one to back down from a challenge, I took it upon myself to try and prove the nay-sayers wrong.
By the end of this post, I hope to have accomplished two goals. The first is giving the reader a better alternative to a generic traffic log collection endpoint by setting up OPNsense. OPNsense comes with a log management system preconfigured that will be on par with any other free solution you want to ship them off to. The second goal is to learn more about alerting and counter measures to malware traffic. Suricata has a lot of options available to you with a bit of tinkering. While this post will focus primarily on the pre-requisite setup, more posts down the line will dive deep into network based countermeasures. Don’t fret, there will be some discussion on rules and their corresponding alerts.
Bear with me through the setup process, there’s a lot that needs to be done before moving onto the fun bit of actually writing these rules. If you want to skip the setup for OPNsense and go straight to the section on generating traffic samples and writing detections, you can click here or just scroll down to the relevant parts. There is also a ton of setup required for enabling Lua for Suricata, and that has its own section dedicated to it.
NOTE There is an assumption of baseline skills or the ability to search unknown terms and learn on the fly. Things like CIDR notation, what a subnet is, how to exit Vi, that won’t be reviewed.
The Hypervisor
Starting from the top, the hypervisor being used. I am choosing to use Proxmox. Proxmox ships with their enterprise updates configured, so if you don’t have a license you will need to disable these. Don’t skip this step, it’s important to make sure that you’re updating from the correct repositories otherwise you won’t get any updates. Proxmox outlines the process here but I’ve also included a brief summary of the steps below. Note that bookworm is the latest release I am configuring but in the future this will change. Adjust to your needs.
Configure Proxmox to update from the non-enterprise repository by moving the enterprise repo to a backup location /etc/apt/sources.list.d/pve-enterprise.list and then creating /etc/apt/sources.list.d/pve-no-subscription.list with the below content.
1
deb http://download.proxmox.com/debian/pve bookworm pve-no-subscription
Next configure the /etc/apt/sources.list file.
1
2
3
4
5
deb http://ftp.debian.org/debian bookworm main contrib
deb http://ftp.debian.org/debian bookworm-updates main contrib

# security updates
deb http://security.debian.org/debian-security bookworm-security main contrib
Once this is done, run apt update and you should be able to pull the latest updates.
Alternatively, there is a script available to do all the configurations for you available here. Of course, please review the script and what it executes before running it yourself. The script will handily also disable the subscription nag prompt and adjust some other quality of life things like the HA configuration which most don’t need.
Next, we need to configure the primary VNet and our secondary unmanaged VNets. Proxmox has another helpful guide for that here which includes the apt installs and configuration changes, but again I’ve documented the steps below. This lab configuration requires three VNets. The first VNet will have a subnet defined and SNAT enabled as this will be the route out to the internet, but the other two will be left to be managed by OPNsense.
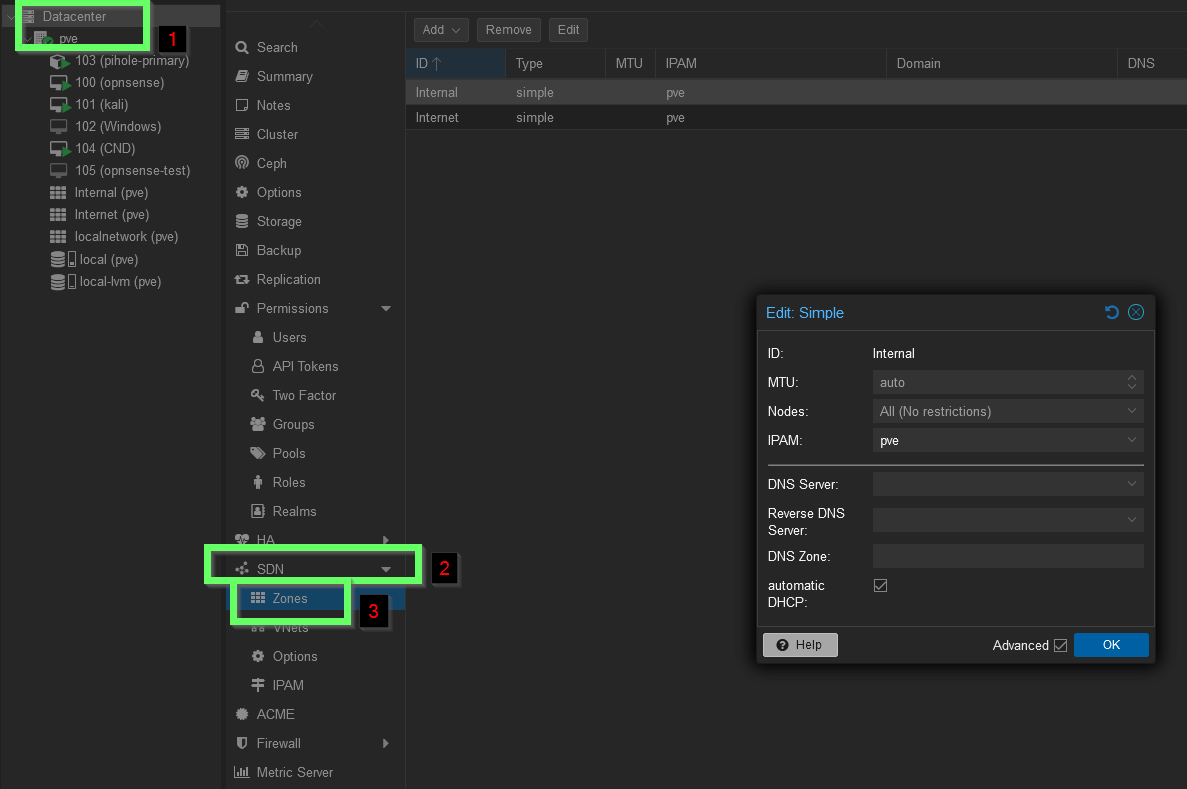
Access the Proxmox shell by navigating to the pve tab under the root Datacenter directory and then click >_ Shell. Run apt install dnsmasq to get a very lightweight DNS/DHCP server. DNSmasq is designed to support small networks and handle the DNS/DHCP requirements, as well as the router advertisements and the network boot and defaults to using the host DNS settings. With that installed, back in the web GUI, navigate to Datacenter > SDN > Zones and create a new zone. Give it an ID you will recognize if you have multiple (in this case I have internal and internet) and ensure you tick the box for automatic DHCP.
With that set, under SDN navigate to VNets. This is where SNAT will be configured to allow one of the VNets to reach the outside network by forwarding requests. In my case for VNets I have configured, there is VNetInt, OPNsense, and OPNS2. Only VNetInt has SNAT enabled.
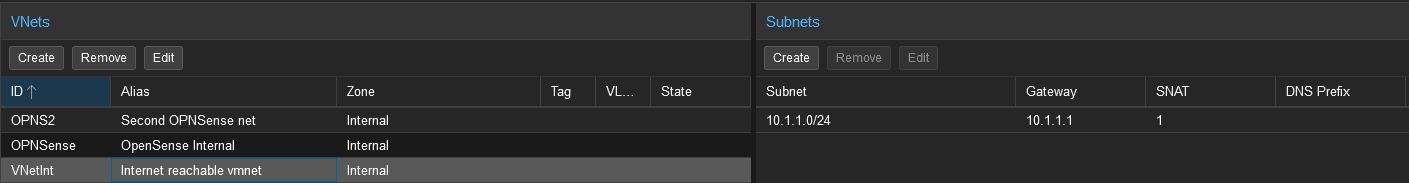
After all of these steps are completed, navigate up one menu to the SDN and make sure you hit apply to apply the changes made.
The VMs
Next, it’s time to setup OPNsense, Kali, and a victim machine to emulate attack traffic to. The victim machine can be anything you want, I chose to use a clone of my Kali machine and set it up on the 3rd VNet, OPNS2, to emulate what cross interface traffic looks like.
OPNsense
TIP In this section, you may see IP mismatches between what’s written in one place versus another. For example, one image shows the
WANas10.1.1.3and another shows it set to10.1.1.5. This is because I rebuilt OPNsense to get more documentation pictures and didn’t stick with the same exact IPs, don’t read too much into it
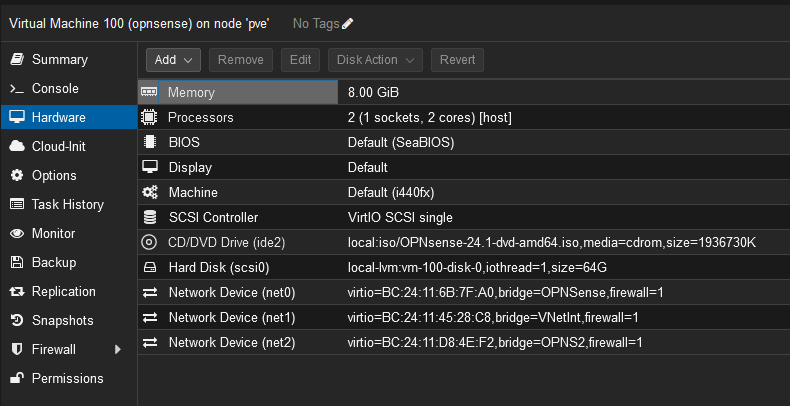
The OPNsense VM is going to be our route to the internet for the two unconfigured VNets created when setting up the Proxmox networks in the hypervisor step. I chose OPNsense because of issues with PFSense that cropped up after Netgate took over, but a lot of the steps I will go through below are probably translatable from one to the other if you feel more confident using PFSense. My OPNsense VM has two cores, 8GB of RAM, and 64GB of storage. I also configured it with three network adapters, assigning each to a VNet.
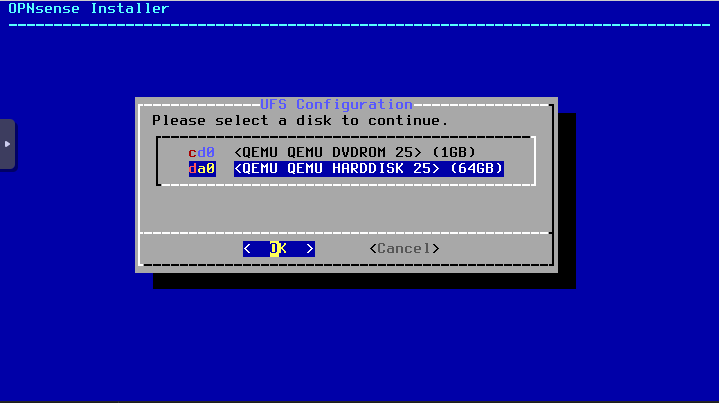
After the hardware is set, you’re ready to turn on the OPNsense VM. When you do, you are presented with a few options but you’re not going to bother with them. When asked to import a configuration, select no. For the manual interface assignment, also select no. OPNsense will perform some autoconfigurations and then prompt you to log in. Use the account name installer and password opnsense to kick off the install process. Be sure to double check you’re using the correct disk to install to:
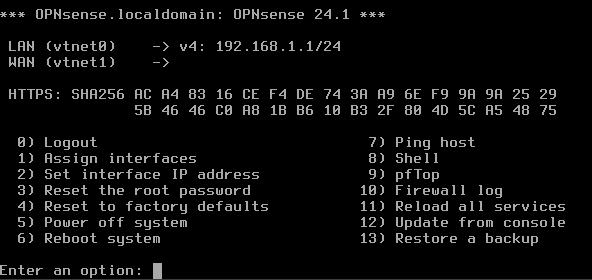
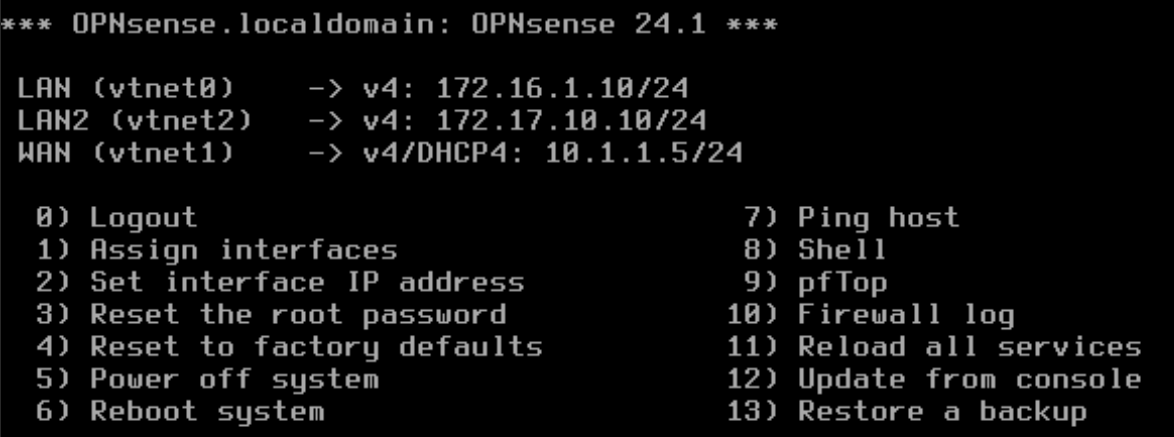
Again use the default options for everything else and reboot to finally log in as root with the same password as the installer account (unless you opted to change it.) Now to configure some interfaces. Your VM right now most likely looks similar to mine below. You only have two interfaces, missing the third that is setup under the hardware options.
You will have to use options 1 and 2 in the terminal to set all three interfaces up properly but a bit of fiddling should get you there. For ease of reference, I suggest popping the console out and having it next to your hardware configurations like I have in order to easily see which device is which MAC address.
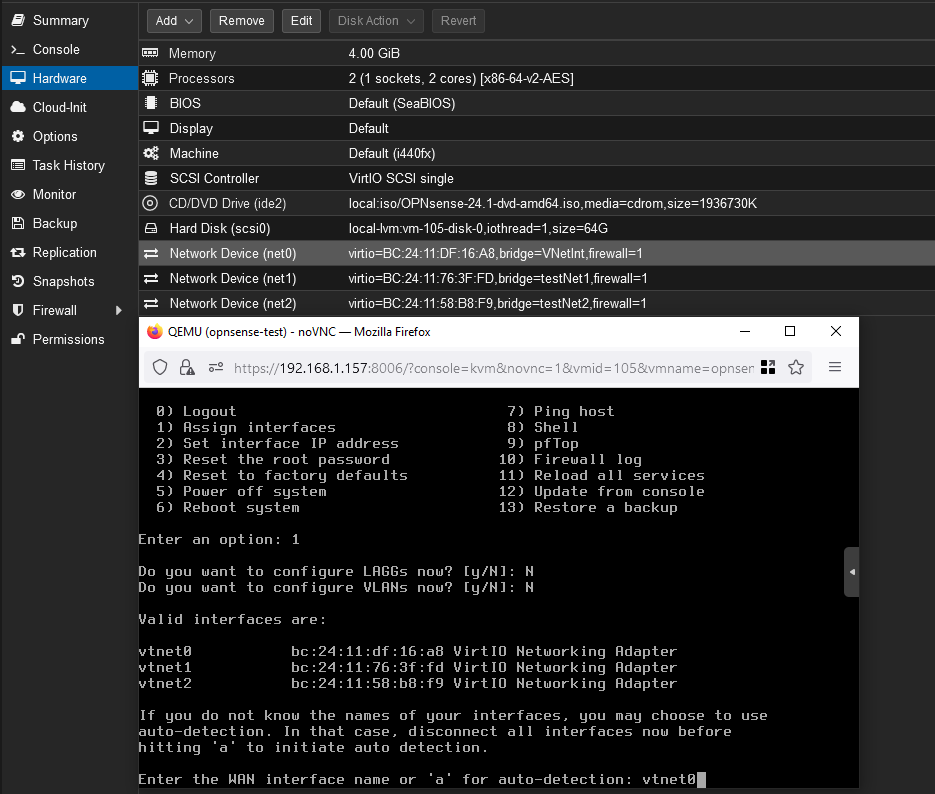
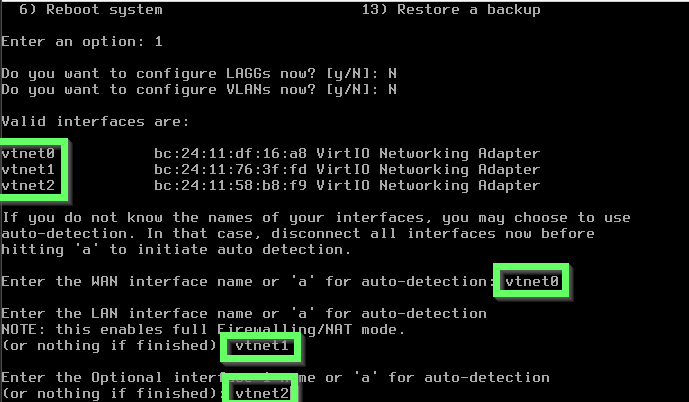
Use option 1 to begin configuring the WAN and select no to the LAGG and VLAN options. LAGG is for link aggregation and we’re not playing with VLANs right now. Next you will be prompted for the interface name. In my case, vtnet0 in OPNsense has the same hardware ID as the hardware network adapter assigned to the SNAT network in Proxmox so that’s how I know it’s the right choice. Next you will be prompted to enter your LAN interface name so do the same. This one is more flexible, both the remaining VNets are fine to use here and the one you don’t choose you will just assign to the additional opt1 interface afterwards.
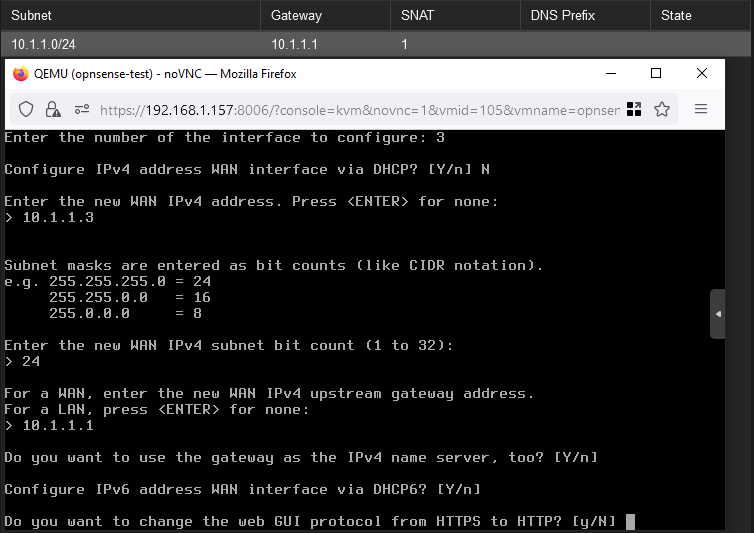
Once the interfaces are assigned, you can begin configuring them. Using option 2, begin with setting up the WAN interface. I’ve opted to manually configure the IPv4/6 addresses, leaving 6 blank for now. Recall the WAN is the SNAT network so you need to assign an IP in the range you defined for it in the hypervisor step, along with using the same gateway and CIDR notated subnet.
With the WAN configured, now do the same steps for the LAN and OPT1 interfaces, just be sure to select a different IP range for each of them. For the sake of clarity when observing traffic, I opted to put them on the 172.16.1.0 and 172.17.10.0 ranges. The only extra step for these configurations that wasn’t done for the WAN is to enable the DHCP server, define an IP range, netmask in CIDR notation, and set a gateway. The gateway is what you set as the interface IP in OPNsense. As shown in my configuration, the interfaces each match up with their interface shown in the hardware settings.
That’s it for now in the OPNsense terminal, now for our attack box.
The Attack Box
This parts the easiest of the whole guide. For the attack box I suggest assigning 4GB of RAM and 2 processors, but this is really preference. Add a new Kali virtual machine and edit the network device so that it uses the LAN bridge configured for OPNsense. This will allow you to reach the OPNsense web management interface and you will have a route from the 172.16.1.0 network through the 10.1.1.0 network out to the internet.
For the C2, I want to write Suricata rules relevant to my personal tools, so I’ll be using CloakNDagger. Feel free to use whatever you would prefer though instead.
Final Clean Up Steps
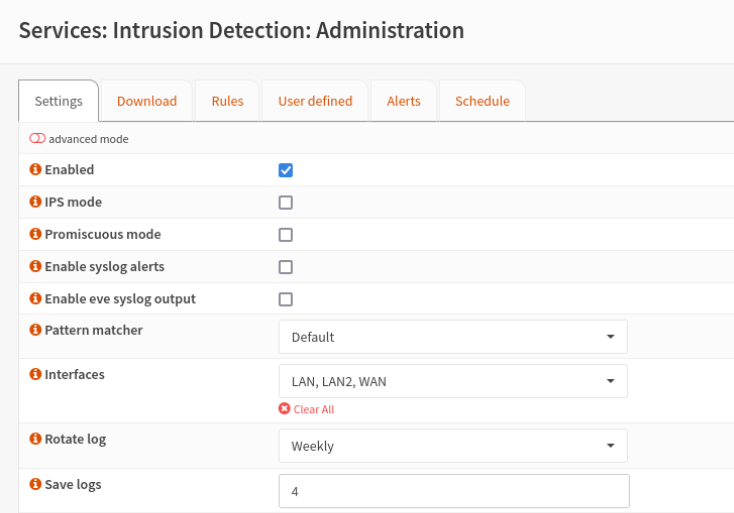
Assuming you have your attack box on the LAN interface for OPNsense, navigate to the gateway IP in your web browser and login with the username root and the same password you’ve been using. I suggest skipping the Wizard you’re prompted to go through on first login. After that, navigate to Firewall -> Rules -> InterfaceName and add two rules to both the internal interfaces that allow traffic in and out unrestricted. Next, navigate to Services -> Intrusion Detection -> Administration -> Settings tab, turn the IDS on by checking Enabled, and then make sure the interfaces that you setup are selected. Mine looks like the below:
You’re ready to begin with your attack traffic analysis and rule creation!
Generating And Analyzing Attack Traffic
Now that the different boxes are ready, OPNsense is configured, and traffic is flowing, let’s dive into Suricata. There’s been quite a lot of setup leading up to this but it’ll all have been worth it. Ensuring the lab is configured properly for routing and analyzing traffic is much more arduous than the actual rule writing.
The Attack Traffic
Using your C2 of choice, setup a listener and generate a standard payload. Send the payload over to your victim machine and, when you start getting traffic back, you’re ready to begin some monitoring. Go back to the OPNsense web GUI and take a look at traffic flowing through the firewall using Firewall -> Log Files -> live View. If you don’t see interface to interface traffic and are not getting implant responses, then a firewall rule is probably denying it.
Suricata Rules
Once you’ve confirmed traffic is flowing from your C2 to the victim machine, you’re ready to start writing Suricata rules. But like everything else in this writeup, there’s a couple prerequisite steps to complete first. Adding custom rules to Suricata is not as simple as writing one and pasting it into the interface. There’s a few methods available but the one I will walk through requires you to host your rule files in a Git repo and to add an XML file to Suricata’s OPNsense configuration. You can follow the forum post here for the forum thread on adding your custom rules but again I’ve documented the pertinent information below. Thanks, as always, to the original author dcol.
Create custom.xml in the directory /usr/local/opnsense/scripts/suricata/metadata/rules/ and add the following lines:
1
2
3
4
5
6
7
8
<?xml version="1.0"?>
<ruleset documentation_url="http://docs.opnsense.org/">
    <location url="https://raw.githubusercontent.com/matt-culbert/suricata_rules/main/" prefix="cnd"/>
    <files>
        <file description="rules for detecting CND">cnd.rules</file>
        <file description="Custom" url="inline::rules/cnd.rules">cnd.rules</file>
    </files>
</ruleset>
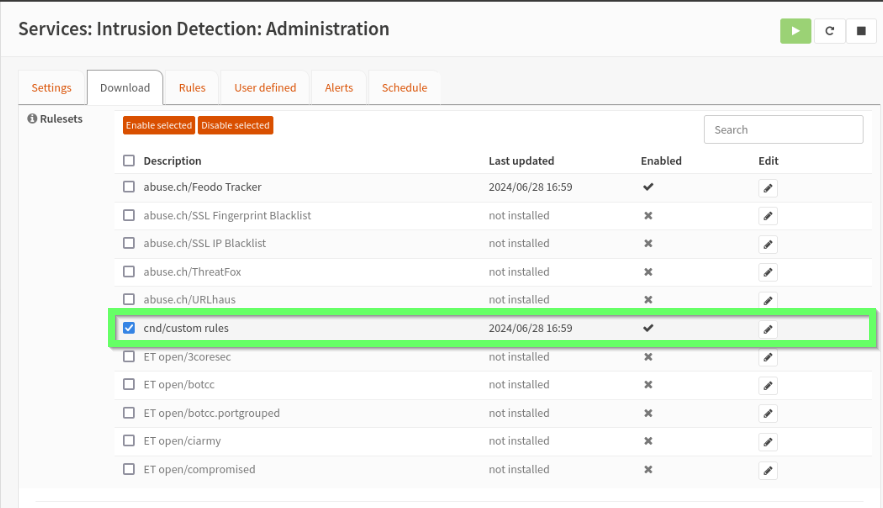
This file tells Suricata that there’s an additional rule set available to download from the URL specified and it has the prefix cnd and full file name of cnd.rules. Be sure to use raw.githubusercontent.com instead of github as this will provide services with only the rendered text. With the custom.xml file created, when you reload the Download tab of the IDS, you should see that Suricata has an additional option for your repo.
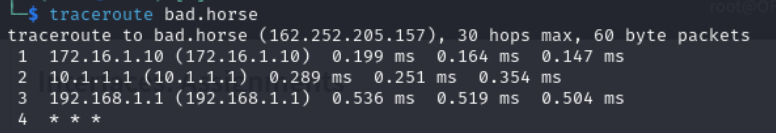
Before downloading these rules though, we have to create some first. But what do Suricata rules look like? The documentation is very thorough and can be found here for version 7.0.5. If you find yourself confused while reading, refer to the docs for a better explanation. Let’s review an example rule. C2’s often use a non-standard port range and alerting on this is simple. In the below example, the rule action is to alert on traffic that uses the protocol tcp from a source of the home_net to a destination that is anything with a port range higher than the standard reserved. The syntax is very intuitive, in this case 1024: just tells the rule to look for any port above 1024. Traffic flow for the rule is dictated by the ->, indicating that traffic flowing from the home network to anywhere else will be analyzed, but the reverse won’t be.
alert tcp $HOME_NET any -> any 1024: (msg:"A non standard port was requested HOME flow to EXTERNAL"; sid:100000001;)
Add the rule to your Git repo and wait for the githubusercontent domain to update, then you can download and enable it. You’ve got your first rule!
There’s so much more to rules than that brief example, but I think it’s more beneficial to look at them in context to the scenario we’ve setup. First, we need to get an idea of what the C2 traffic looks like on the wire. OPNsense has a built in tool for just such an occasion. Under Interfaces -> Diagnostics -> Packet Capture you have the option to launch a packet capture for any interface. Select the appropriate one and, with C2 traffic running between it and your victim machine, begin the PCAP. After a sufficient amount of time with check-ins and command execution, there should be enough data in the PCAP so stop it, download it, and open it in Wireshark. There’s a lot that CloakNDagger gives defenders to begin searching for it on the wire. The first and easiest place to look at is the default certificate that it ships with. Just generate a JA3 fingerprint which Suricata can then use for alerts. Install JA3 on the machine you’re using to look at the PCAP with pip install pyja3 and run ja3 -a <pcap>. The -a flag is required to find the client Hello's on any port:
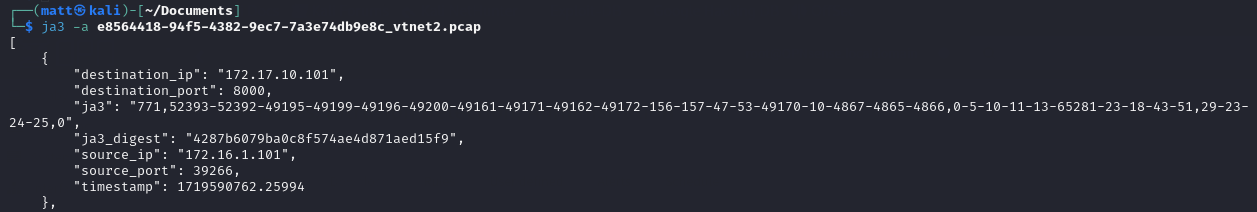
NOTE We will enable JA4 signatures later on when we re-install Suricata as part of the process for enabling Lua
For each stream in the PCAP, JA3 outputs some details about the source and destination and two fingerprints of the server. The digest field is what will be used for the next rule we will create. These are easy to include in rules, just specify the ja3.hash flag followed by a content flag containing that digest:
alert tcp any any -> any any (msg:"Match JA3 digest"; ja3.hash; content:"4287b6079ba0c8f574ae4d871aed15f9"; sid:10000002;)
With this in place, the following alert gets generated:

That’s all well and good but if that cert is rotated then this is no longer an effective alert. Have no fear, you can alert on quite a few field and multiple fields at the same time. Take for example the TTL seen in requests. While it is consistently 63, this alone isn’t enough to confidently say that seeing it is an IOC. However, combine this with also filtering on the header length, and now the rule is very scoped down to only the malicious traffic. I can confidently say this because in Wireshark you can add filter flags in the PCAP to narrow down your search, and once you’re finished there you can then translate almost all of those into Suricata flags:
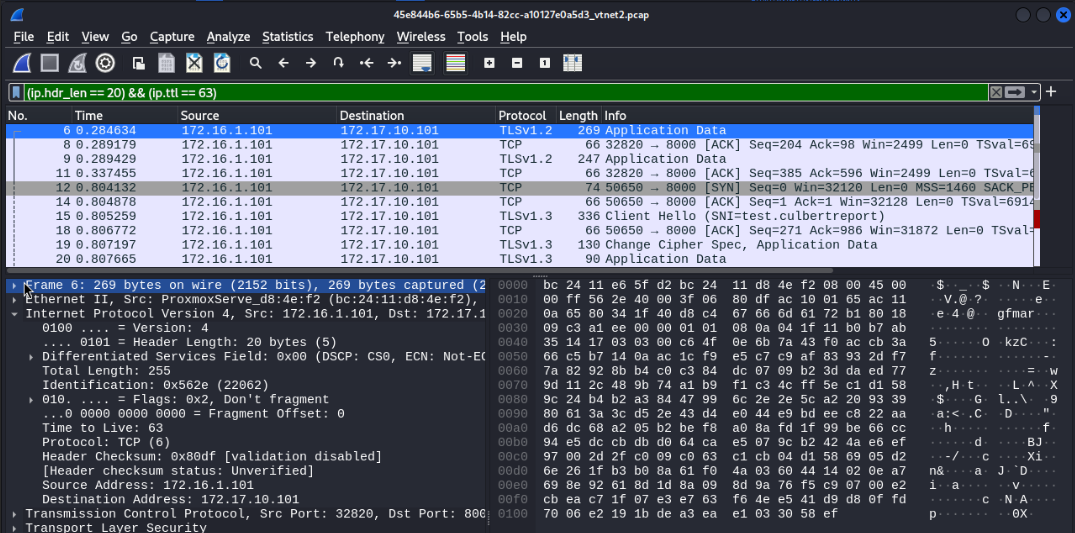
alert tcp any any -> any any (msg:"Match header length and TTL"; ipv4.hdr; bsize:20; ttl:63; sid:100000003;)

Zooming back out, a broader pattern that can be alerted on is how low quality C2 configurations generally check-in at a consistent pace. Compare the two traffic samples below, one a check-in process and the other a request for yahoo.com:
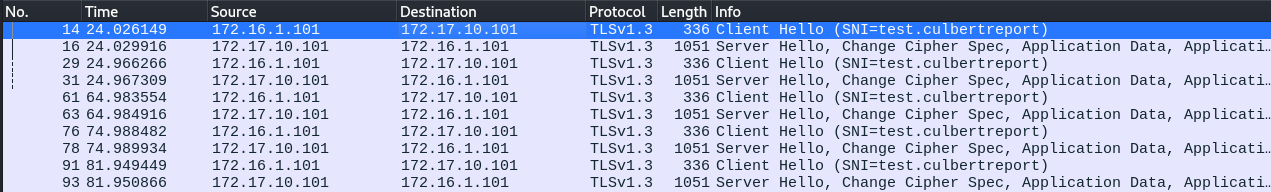
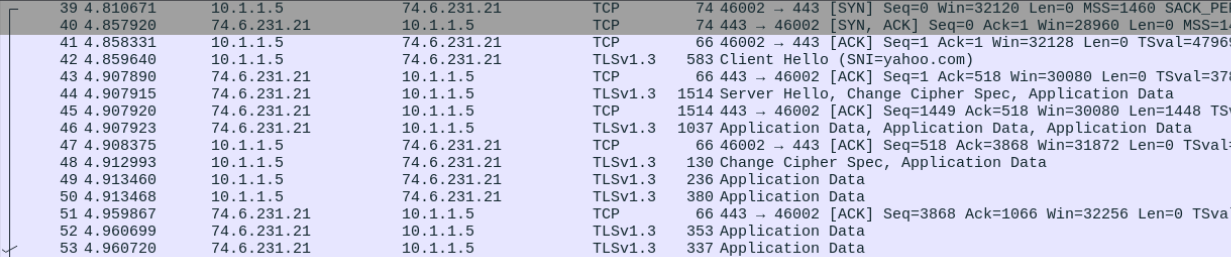
You can see that a series of partial handshakes are being performed regularly and no data is being exchanged, i.e. a check-in is occurring where the C2 is queried for any waiting commands. A high jitter and sleep time can help lower this detection confidence but it’s a very telltale sign of malicious traffic. An alert for this process would look like the following, taking advantage of the threshold flag to set a required number of occurrences and track by_src to set which address we are tracking that threshold by:
alert tcp any any -> any any (msg: "Matched TCP flags for CND"; tcp.flags:AP; threshold: type threshold, track by_src, count 6, seconds 60; sid:100000004;)
Hmm this alert is quite noisy but there is a type set already as threshold which means that there can’t be another limiter added. OPNsense again has you covered with the threshold.config file located in /usr/local/etc/suricata. This lets you set additional thresholds for any alert. In the case of the above rule, the added threshold will look like the following: threshold gen_id 1, sig_id 100000004, type limit, track by_src, count 1, seconds 60
Now there should only be one alert per tracked source IP every minute. This can be further adjusted as you see fit for your environment and be done for any rule you need. Which brings us to the crux of Suricata. When writing rules, your environments uniqueness is your strength. You may find that the provided rules here are loud and alert on false positives without additional tuning. That’s the great thing though about these rules, the patterns I set here only picked up the traffic I needed it to. This is only the surface of Suricata and OPNsense - we haven’t even touched the Lua scripting engine that can have traffic offloaded to it for further alert and log generation.
Lua
Configuring Suricata to support Lua took maybe the longest part of this whole writeup. There’s little documentation I’ve found from people who have added Lua support to OPNsense instances running the Suricata IDS so, through a lot of trial and error, I’ve tried to document the process here as fully as I can. I’ve walked through these steps a number of times on a fresh VM so I feel fairly confident nothing is missing. If you want to skip the manual configuration, I’ve also compiled the below steps into a sh script that can be downloaded from my Git here.
Configuring Lua Support
Out of the box, Lua support is not enabled. You can check this by running suricata --build-info | grep LUA and you will get an output like the following (if yours is enabled, congrats!):

To enable this, there’s a bunch of requirements that need to be met first. To start, Rust needs to be installed alongside a few other pkg components. To install these requirements run pkg install lua54 autoconf automake libtool pkgconf wget git. Next up is to download Rust. The download is piped right to sh which is always risky so review the URL and script before continuing. curl https://sh.rustup.rs | sh and just use the default options. After Rust is installed, there’s some manual configuration required for adding it to the path. Using vi, edit ~/.cshrc and at the bottom add the following entries:
1
2
setenv PATH $HOME/.cargo/bin:$PATH
setenv CARGO_HOME $HOME/.cargo
Then run source ~/.cshrc after writing the changes to reload the terminal config.
Now to update Suricata. Instead of using git to clone the Suricata repo, which downloads the latest dev release, I suggest using wget to download the latest stable release. These can be found by navigating to https://github.com/OISF/suricata/releases. When you find a suitable version, download the tarball with wget by supplying it with the download URL, then untar it. Navigate into the new Suricata directory and run git clone https://github.com/OISF/libhtp to pickup another required library followed by cargo install --force cbindgen for a missing Rust library. Once both requirements are met, run ./autogen.sh.
Before running configure and make, there’s some manual linking required. Lua is currently setup in paths that Suricata is not looking in and so won’t find it. Resolving this requires creating a few symlinks:
1
2
3
4
5
6
7
8
9
10
ln -sf /usr/local/include/lua54/lua.h /usr/include/lua.h
ln -sf /usr/local/include/lua54/lualib.h /usr/include/lualib.h
ln -sf /usr/local/include/lua54/lauxlib.h /usr/include/lauxlib.h
ln -sf /usr/local/include/lua54/luaconf.h /usr/include/luaconf.h
ln -sf /usr/local/include/lua54/ /usr/local/include/lua

ln -sf /usr/local/lib/liblua-5.4.a /usr/local/lib/liblua54.a
ln -sf /usr/local/lib/liblua-5.4.so /usr/local/lib/liblua54.so

ln -sf /usr/local/libdata/pkgconfig/lua-5.4.pc /usr/local/libdata/pkgconfig/lua.pc
WARNING The file
lauxlib.his not misspelled and you may have misread it the first time. Trying to look out for all the other people reading things too quickly like myself.
We’re getting close to the end, I promise. Two more edits to make sure Lua can be found. Still in your new Suricata directory, run setenv LUA_CFLAGS "-I/usr/local/include/lua5.4" and setenv LUA_LIBS "-L/usr/local/lib -llua-5.4". These are to set compiler flags in the Makefile. Now it’s finally time to run configure ./configure --enable-lua --with-lua=/usr/local/lib followed by make && make install-full to complete the setup. Then just restart the service and when suricata --build-info | grep LUA is run again, it shows as enabled.
NOTE Some of the absolute paths I have used may be different for you. If you use one and find that it results in an error while running
make, be sure to re-runconfigureafter each adjustment you do before you try and runmakeagain. Some errors may require you to go back a step further and run./autogen.shbeforeconfigure. When all else fails, start from the top withmake clean, followed by./autogen.sh,configure, andmake
In addition to Lua being enabled, if you run suricata --build-info | grep yes you can see all the enabled components. Among these, JA4 is there.
Writing Lua Scripts
So you’ve got Lua enabled, but what does a Lua script look like? Suricata’s documentation is seriously your biggest asset, use it, love it, cherish it. All scripts require an init function in them which determines which piece of the packet to pull in. For this example, it will be for generating an alert. Alerting has stripped down requirements versus generating a log entry. Note that, depending on what you want to alert on, different packet properties have different needs. For instance, to analyze TLS packets, the init function would look like the following:
1
2
3
4
5
function init (args)
    local needs = {}
    needs["tls"] = tostring(true)
    return needs
end
Then, to alert on a self-signed certificate, you would pull out the issuer and subject fields from the certificate and compare them. If it is true that the two fields are the same, the rule has a match and will generate an alert:
1
2
3
4
5
6
7
8
function match (args)
    version, subject, issuer, fingerprint = TlsGetCertInfo()
    if subject == issuer then
        return 1
    end
    return 0
end
return 0
Using this script in a rule is simple, just add lua: script1.lua anywhere you want it to be run. For instance, a simple version would look like this:
alert tcp any any -> any any (msg: "Lua script found a self signed cert"; flow:established; lua: script1.lua; tls.store; sid:100000007;)
The alert looks for an established flow, which just means that the connection is fully established, and on a match the tls.store keyword indicates that the cert is stored to the disk. This allows further analysis with JA3/4. When this alert is triggered, it looks like the below:

There’s more than just alerting however, there’s also the option to generate robust log information. By changing the init function from needs["tls"] = tostring(true) to needs["protocol"] = "tls" and the match function to log, you can now generate log messages for certain traffic patterns. The log scripts are more involved than match scripts as they also require additional setup functions and deinit functions, but it’s not a big jump in difficulty. These will be explored more in later posts.
Wrapping Up
And that’s it! I would say more than half the guide is dedicated to the proper configuration, but having that correct means way less headaches down the line. I’d add more to the Lua and Suricata sections but this post is very long as is. Best to save that for a future post instead.
My goal with writing this was to help create a baseline with where to start with OPNsense and lay out some paths to progress with to expand what you’ve created here. You should have a set of interfaces, subnets, and three firewalls to fiddle with in addition to the Suricata and Lua rules.
If you’re undecided about next steps, one would be to play with the drop function for alerts. After all, if traffic patterns match your rules for malware, why should they be allowed to keep flowing freely? This will be a real test of your rule writing as you don’t want to inadvertently affect normal traffic flows. Additionally, as I mentioned JA4 support is enabled now for your rule engine, so check out the expanded fields offered.
While this guide focused almost solely on Suricata, there’s a lot more to OPNsense than just this. Other aspects you can consider are setting up the VPN service. There is a WireGuard VPN built into it and, for those uninitiated, WireGuard has quickly become one of the dominant forces in the VPN industry for good reason. It’s fast, lightweight, and works on about any platform. Or if you want instead, you can start setting up additional interfaces with VLANs and learn more about VLAN tagging. And all of these services can be filtered through the IDS engine you spent so long setting up.