
This is a run through on setting up Grafana to pull data from Nessus and tasks from Jira.
Prerequisites:
- Two VMs capable of 4 GB of RAM, 2 Cores, 32 GB Disk space each.
- Nessus Version: Nessus-8.10.0-es8.x86_64.rpm
- Installed with: rpm –ivh Nessus-8.10.0-es8.x86_64.rpm
- OS: Fedora 31-1.9
Setting up Grafana
- Add a new file to your YUM repo and populate it with the data below.
- sudo nano /etc/yum.repos.d/grafana.repo
- [grafana]name=grafanabaseurl=https://packages.grafana.com/oss/rpmrepo_gpgcheck=1enabled=1gpgcheck=1gpgkey=https://packages.grafana.com/gpg.keysslverify=1sslcacert=/etc/pki/tls/certs/ca-bundle.crt
- Once that is done, we can install Grafana
- sudo yum install grafana
- We will need to allow this through on the firewall, it uses port 3000
- Firewall-cmd -–add-port=3000/tcp --permanent
- Firewall-cmd –reload
- Log into the Grafana dashboard at <localhost>:3000, the username and password is admin/admin
On first login, and after updating the admin password, we are presented with a view of tasks to be done. The first is to add a data source. Select MySQL and enter the host IP, database name, DB username/password, and be sure that the user only has the SELECT permission on the database. Name this after the first client, you will be working with. Save & Test.
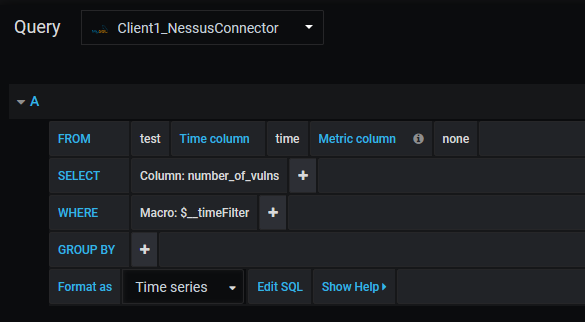
We will then set up a new dashboard. Mouse over the + and click Dashboard. You should now see a new view with a blank panel prompting you to add a query or choose a visualization. Click Add Query. You will be brought to a screen showing a MySQL query that we will modify. First, depending on the client that you are setting up, you want to select from the “query drop down” menu the correct client we are writing this for. If this dashboard is for Client 1, make sure the query is for Client 1. Modify the query to reflect the below image. We are telling MySQL to pull data from a table called "test" and select the column "number_of_vulns", and "time" which we'll use to chart a trend graph.

Setting up SQL Clients
We need to setup a test client with a MySQL DB to emulate how our Nessus scanner will send results.
- Edit the MySQL cnf file to add the line
- bind-address = IPofGrafana
- Login as root to MySQL and create the database and user
- CREATE DATABASE nessus_scans CHARACTER SET utf8mb4 COLLATE utf8mb4_bin;
- CREATE USER 'client1_sql_connector'@'localhost' IDENTIFIED BY 'Str0ngDBP@ssw%rd';
- GRANT SELECT on nessus_scans.* TO 'client1_sql_connector'@'IPofGrafana' IDENTIFIED BY 'Str0ngDBP@ssw%rd';
- FLUSH PRIVILEGES;
- QUIT;
- Create the table for Nessus results
- CREATE TABLE test( id int NOT NULL auto_increment, time datetime NOT NULL DEFAULT CURRENT_TIMESTAMP, number_of_vulns INT NOT NULL, PRIMARY KEY (ID) );
- The insert statement I used to test this:
- INSERT INTO test (number_of_vulns) VALUES (50);
- Id and Date are auto calculated, we only need to fill in the number of vulnerabilities detected for our test.
- INSERT INTO test (number_of_vulns) VALUES (50);
Create additional databases and tables for each piece of software being used. Pictured below are the Grafana customization's for each panel and the table layout.
A note about Nessus. As many will point out, Nessus no longer allows base installations to utilize API functionality. You need to have Tennable IO or Tennable SC to be able to utilize the API at all. In a later post, I will go over how you can setup a query to pull the necessary fields we use here and display them on Grafana, but for now this can be populated with test data. When we do get the API setup, we will be pulling down the total number of vulnerabilities detected in that scan so that we can make a trend graph and show rises and falls over time. Below, you will find screenshots of how both this Jira and Nessus Panels are setup, to give you a better idea of what the queries look like.
Jira Tasks Panel


Nessus Vulnerabilities Panel

Connecting Jira DB to Graphana
I think this needs a section all of it's own. I didn't go through the Jira API in order to pull who was working what tasks and instead wrote some SQL queries and generated a special user to query the Jira DB. At the time of writing this, it was a lot quicker to do and because the user was only granted select, I wasn't too worried about the security of this. If I could go back and spend more time on this, I would definitely work with the API to pull the needed information into a seperate SQL DB then import it from there. I actually recommend doing it this way because it will allow you to correlate the usernames of assignees on tickets with their internal Jira ID better. As it stands right now, when this displays ticket statuses, the assignee column will say JIRAUSER10000 instead of my username. The usernames are stored in another table, app_user. Without further ado, here is how Jira lays out the MySQL DB and how you can pull from it.The table we will be referencing is called jiraissue. It holds the issue summary, type, creator, assignee, and a whole host of other descriptors.
Jira.jiraissue layout:

We will be using the "created", "assignee", and "summary" fields. Create a new user like the one below:

We then grant select to our new user for this table:
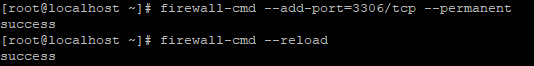
It’s important as well to open 3306 on the firewall to allow Grafana to make SQL calls:
And finally the Grafana board properties:
